
vue中如何使用chart.js图表绘制工具库实战详解
<template>
<canvas id="myChart" width="400" height="400" ref="myChart"></canvas>
</template>

<script>
import {Chart, LineController, LineElement, PointElement, LinearScale, Title, CategoryScale } from 'chart.js'

export default {
name: 'HelloWorld',
mounted(){
// var ctx = document.getElementById("myChart");
var ctx = this.$refs.myChart;
Chart.register(LineController, LineElement, PointElement, LinearScale, Title, CategoryScale);
var myChart = new Chart(ctx, {
type: 'line',
data: {
labels: ["Red", "Blue", "Yellow", "Green", "Purple", "Orange"],
datasets: [{
label: '# of Votes',
data: [12, 19, 3, 5, 2, 3],
backgroundColor: [
'rgba(255, 99, 132, 0.2)',
'rgba(54, 162, 235, 0.2)',
'rgba(255, 206, 86, 0.2)',
'rgba(75, 192, 192, 0.2)',
'rgba(153, 102, 255, 0.2)',
'rgba(255, 159, 64, 0.2)'
],
borderColor: [
'rgba(255,99,132,1)',
'rgba(54, 162, 235, 1)',
'rgba(255, 206, 86, 1)',
'rgba(75, 192, 192, 1)',
'rgba(153, 102, 255, 1)',
'rgba(255, 159, 64, 1)'
],
borderWidth: 1
}]
},
options: {
scales: {
yAxes: [{
ticks: {
beginAtZero:true
}
}]
}
}
});
},
data () {
return {
msg: 'Welcome to Your Vue.js App'
}
}
}
</script>

<!-- Add "scoped" attribute to limit CSS to this component only -->
<style scoped>
h1, h2 {
font-weight: normal;
}
ul {
list-style-type: none;
padding: 0;
}
li {
display: inline-block;
margin: 0 10px;
}
a {
color: #42b983;
}
</style>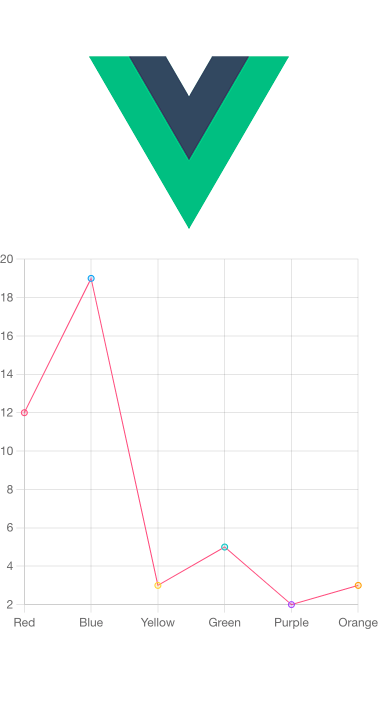
更多资料介绍:https://chartjs.bootcss.com/docs/


评论